
Case Studies


IT Expenditure
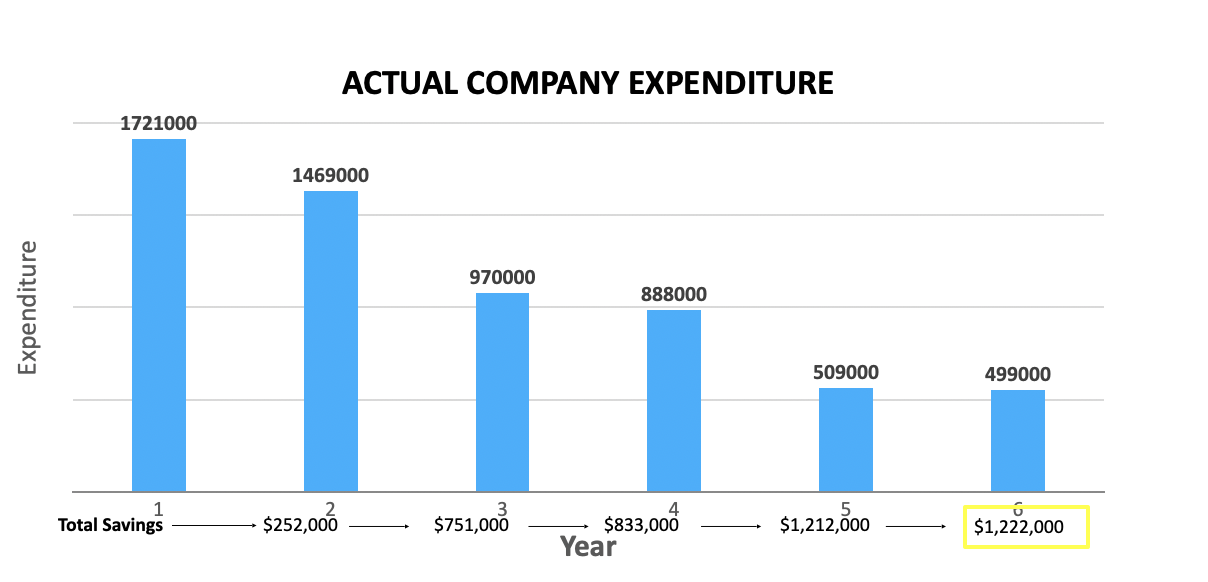
Company A serves customers in multiple states with 50+ branch locations and has over 1,100 associates:
Annual Revenue: >$750 Million
- Year 1 Telecom/ IT Expenditure $1.721M
- Year 2 Telecom Expenditure $1.469M
- Year 3 Telecom Expenditure $970,828
- Year 4 Telecom Expenditure $888,211
- Year 5 Telecom Expenditure $509,352
- Year 6 Telecom Expenditure $499,652
Post audit recovered cash amount for “Company A” $398,964.16
MarqPointe managers have helped companies of all sizes both reduce costs while increasing the caliber of service. We never sacrifice price for quality.
Client Success
Company operates 74 long-term health care centers with 9,403 beds. Company affiliates also operate 36 homecare programs, five independent living centers and 20 assisted living communities.
Annual Revenue: $1,028 Billion
- Year 1 Telecom Expenditure $1.72M
- Year 1 Cable and Digital TV Expenditure $1.17M
- Year 2 21% Decrease in Total Expenditures
- Year 3 42% Target Decrease in Total Expenditures